
The most successful charts use a minimal amount of information in order to avoid distractions like background images, gridlines, strange colour schemes, and elements like legends that tend to clutter the look of the chart on a slide.
Simplicity rocks here too folks!
The charts used in PowerPoint come by default from Excel, so the options are every bit as limited as they are in Excel.
How to Create Charts in PowerPoint 365
Keep your charts as clean as possible by removing the following:
- Gridlines
- Chart titles (use your preset headings for your slides instead)
- Legend
Create a Custom Legend
Using 3D charts, you need to be careful. Used appropriately and only on occasion it can make a powerful impact on your presentation. Used for the sake of using 3D could cause your slide to be much harder to understand.
3D adds value only if you need to convey distance, so understand that most of the time, 3D charts add ZERO value, and it can take away from the ease of reading the information.
Knowing the different types of charts and what they are used for is also important. Choosing the wrong style chart only makes it difficult for your viewers to understand what your numbers are supposed to mean.
Sometimes it can be a bit difficult to figure out what style of chart might be best to use. The following tips may help you.
- Line Charts – best for demonstrating trends over a period of time.
- Vertical Bar Charts – you can use when you want to show percentages over a period of time, and be sure to limit the number of bars used from 4 to 8.
- Horizontal Bar Charts – works best when you are comparing quantities.
- Pie Charts – keeping your pieces to no more than 6 slices, you can use when showing things like total market shares in percentages.
Hint: No one says you have to use ONLY standard models of charts that are offered inside your software. You may even get lucky enough to find better ways to visually display your data. Check out the video below.
This Could Replace Your Use of Pie Chart
Tips for Using Tables
While charts are great for showing relationships and changes in your data, tables are better suited when you are comparing individual values of something. When using the option for adding a table to your slide…

- Keep your table columns and rows evenly spaced.
- Round up your numbers to two digits beyond the decimal.
- Use quiet background colours (The table shown above is the default colours for tables in PowerPoint).
- Cell borders are also white by default as that is the preferred colour.
- Make your text of a reasonable size inside the cells for easy reading.
- Center the title of your table.
- Center column category labels.
- Center your data within the cells.
- Right align your row category labels.
Now, if you find yourself under pressure to meet a deadline and need help creating charts for your presentation, there are websites available with presentation templates built by experts.
One such website that I am now aware of is SlidesGo.com.

DiagrammerTM is another website you may find useful in creating diagrams. They offer the following types of charts.
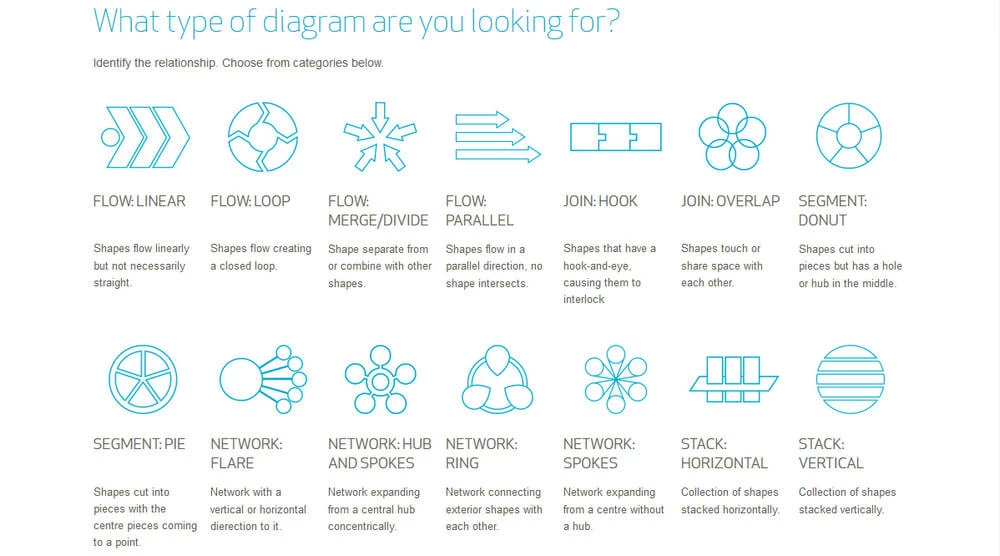
Like the diagrams from SlidesGo, the DiagrammerTM diagrams are fully customizable in PowerPoint, meaning you can change the colours, sizes, fonts, etc.
If you need help selecting the best style of chart for your data, you may find it easier to use the interactive model you can use on the Juicebox website to help you decide.
Then, of course, there is the option for you to download and use a plugin for PowerPoint to help you create customizable charts.
This plugin is offered by Oomfo.com for FREE, once you have completed their form providing them with your name, email, country, job title, etc.

Now for an idea on creating an infographic chart that you could use in your email announcement about your presentation.
Create Infographic Chart in PowerPoint
If you prefer simplicity in your chart, here’s yet another option to consider using.
How to Create Custom Column Charts in PowerPoint
About Animations
Use animations only when you need to illustrate an idea, explain components of a multipart system, or arrange certain messages. When used in moderation you can prevent distracting your viewers.
By animating or introducing your slide elements onto the screen, one at a time, would allow your viewers to follow along much easier than, say, if all elements are introduced at once.
PowerPoint is constantly adding new animations with each new version they release. So, just remember that your goal of your presentation is to have your viewers focus on your message and not the glitzy effects of animation.
In other words, forget about having your text flying onto our slide. Instead, use simple, bold shapes, clever use of white space, images that grab attention, and contrasting colours.
The least obnoxious animations are: appear, fade and fly in. And the least obnoxious transitions are: cut, fade and push. Used sparingly they might help your presentation.
Videos are Great Tools
So, if you have a short video of a customer raving about your product, and your presentation is about your product, be sure to include that video. Videos make a great way to change up the pace of a presentation.
The 10 Minute Rule
What a great way to reset your audience’s attention by presenting a short video. Just be sure to use a SHORT video… 3 minutes or less.
How to Embed a Video in PowerPoint
How to Embed a YouTube Video in PowerPoint
Turn Your Killer Slide Presentation into a Video
Now that video has become so vital to many online viewers, you can use most slide presentation software to make your videos with. Here is all you would need to do in order to create your great video presentation.
- Write everything down that you’re are going to say in the video, and make sure it is absolutely PERFECT before starting the presentation design.
- Create your presentation with only pictures and a few words on each slide. You will need to be able to add the proper timing for your slides to change so that the audio will be easier to match the timing of your slides.
- Then find a professional voiceover person to record your audio in a professional voice in high-resolution. Personally, I do NOT consider myself to have a great voice, and a great radio-type voice can dramatically improve your message.
Besides this, I do not own the necessary recording equipment that professionals use.
The proper equipment definitely makes a difference in how the audio sounds. So, if you do decide to do your own voiceover, seriously consider purchasing professional recording equipment. - Once you have setup your slide presentation, embed the audio file and setup the proper time for each slide so that it matches the speaker perfectly.

- Once your presentation is completed, save your presentation as a video.
- However, if you find it easier to use video editing software to merge your mp3 file and the video file that your slide presentation software creates, there are several free video editing software available to use; Though, you would need to Google search for one to match your OS (operating system).
ApowerEdit is the video editing software that I found easiest to use… and, it is also is available for MAC users. They even offer a free guide for ApowerEdit. - Once you have completed your video, simply upload it to YouTube and embed it wherever you want it seen.
This brings an end to this 5-part series on creating your killer slide presentation. I do hope you have found this helpful, and if so, please feel free to share this with others.
Once again, if you have any questions regarding adding charts and animation to your killer presentation… or converting your killer presentation to video, please leave a comment below.
SOURCE
Slides Made Easy 2nd Edition by Adam Noar
Credit for Header: Photo 119794675 © Lightfieldstudiosprod – Dreamstime.com