Google Analytics is one of the most insightful and productive marketing tools that you can use to measure the traffic (and success) of your online business. This comprehensive tracking system allows you to analyze every detail of your website, including performance, click rate, average traffic, average time spent on your website, successful ad placement and revenue, user behavior, and much much more.
The key to getting the most out of Google Analytics is to understand some of the most important key performance indicators, or KPIs that you’ll need to familiarize yourself with in order to properly read your data.
KPIs define measurements that can help you analyze your website’s performance or the success of your advertising campaigns.
No matter how much of an analysis expert you think you are, it can be overwhelming to be faced with so many metrics at once. Let’s take a look at the top 20 Google Analytics indicators that you should know in order to elevate your research and reporting potential.
1.) Users and Sessions: It’s important to start with the basics. Measuring your traffic is worthless if you don’t know how that traffic develops in the first place. You need to monitor the fundamentals of your website, and that includes users and their sessions.
Every person who visits your website is known as a user, and when they are visiting your website, they are creating a session.
How long or how short the session is has no impact when it comes to counting sessions; a session is a session no matter what. Users can create multiple sessions at once by opening the website in new browser session, a different browser or browser tabs. However, there can never be multiple users per session.
Note that there is a difference between clicks and sessions; users can click on ads multiple times and not have it counted as a separate pageview (Google support column).

2.) Conversion Rate: A conversion is any completed activity on your traffic reports generated by a user or session. Typically, conversions are something that adds to the success of your website or your business.
Conversions can be anything from a user signing up on your email list, completing a purchase, or registering an account username and password on your website. Therefore, the conversion rate is the rate in which conversions occur across your website, measured in a percentage and compared to your total number of users and sessions.
There are many different types of conversion rates, but it’s most important to focus on the goal conversion rate.
As part of Google Analytics, you will set a number of goals that you wish to achieve. If users continue to execute the actions you desire, that will count towards a higher goal conversion rate. The average goal conversion rate is 61.99%, according to an Optimize Smart study.
3.) Bounce Rate: A bounce is defined as a session in which a user only visits a single page.
Single pageviews are not always a bad thing, especially if your user can find everything they need from one page alone.
But, if you’re trying to direct visitors to other pages and services on your website, you might need to assess your bounce rate, which indicates the percentage of single-page sessions out of the total sessions you receive.
A high bounce rate means that people are briefly visiting your website and then leaving. Ask yourself:
- Why is that?
- Is that unhelpful towards your goal?
Then use your answers to those questions as an indicator to tell whether you are doing something wrong or right, and then reassess your user engagement strategies if necessary.

4.) Traffic by Keyword: You can set certain keywords in your Google Analytics tracker to see if the parameters you’ve set up are actually being met. Keywords are important for helping users navigate the Internet through search terms to come across your website and business.
Tracking how much traffic you get based on the keywords you define can be extremely helpful, albeit a basic foundational tactic for measuring success.
Your traffic by keyword can occur in a few different ways, especially through organic keyword conversions or specific keyword conversions.
Organic keywords arise when users start using those terms to search for you on their own, rather than implementing the keywords as a part of your SEO strategy. You can measure the success of your keywords in several ways, and it’s a good indicator to let you know what words people are using when they look for you online.

5.) Keyword Ranking: Your keyword ranking shows where exactly your keywords are located in the biggest search engines (typically Google).
Think of it like a traditional list or ladder of value; the words closest to the top have the most worth. The higher up your keywords are on search engine lists, the better it will be for your business and website.
Depending on the nature of your business, there are some keywords that may naturally rank higher than others. For example, if you run a steak restaurant, the keywords “steak” and “best steak near me” (without the use of quotation marks, of course) will always run high.
If there are other keywords you want to introduce to your Google Analytics strategy, make sure to do a lot of research to see if they have the potential to reach high on the ranks.
Sometimes, Google updates its algorithm, which might affect the placement of your rankings. You can search “recent Google algorithm updates” (again, without the quotation marks) for full details on the most recent algorithm updates.
6.) New Verses Returning Users: Naturally, some people revisit your website consistently, while others may only stop by once and then leave. Tracking your new verses returning users is important for figuring out how many people come back, and why they do or don’t.
You can then use this data to fine-tune a strategy to increase the number of returning users. Individualized content will be more likely to drive new users to come back while keeping a hold of those long-time users to generate new sessions.
7.) Social Media Interactions: Did you know that Google Adwords can track your user’s social media interactions as well?
You can implement social interactions according to the Google Analytics developers. This is a way to further categorize user interactions to determine how successful… or how unsuccessful… your social media profile is at generating traffic to your website.
The more active you are on social media platforms, especially Facebook, Twitter, and Instagram, the more likely you are to find interactions and connections with users who will ultimately come back for returning sessions.
8.) Pages per Session: When a session isn’t bounced, that means a user visited more than one page while on your website. Tracking pages per session is a helpful way to determine how long people stick around on your website.
The average pages per session will tell you not only how much traffic you have, but what the quality of that traffic is. Not all traffic is good traffic; not all traffic works towards you completing your conversion goals. So, tracking the number of pages browsed per session will allow you to make a more meaningful analysis of your user activity.
9.) Time Spent on Page: This is an indicator of how long each visitor stays on an individual page per session. And, this is an important performance indicator to measure alongside your bounce rate, as you can get a better idea of your user’s activity and behaviours through these two means.
The amount of time a user spends on your page can weigh heavily on the quality of your overall website performance. So, if your website doesn’t have additional pages or links to other components of your business, then you may have a “one and done” page for your business.
This means that your website is built to have all information laid out on one page, so users have nothing to navigate through. In this case, the average time spent on page would be higher than average, as would the bounce rate.
But a website that directs users to other tabs or provides links to other areas of your website within the page may have varying time spent on page.

10.) Sources: One of the main mediums for analyzing, tracking, and reporting on Google Analytics is your sources. A source will tell you where people found your website, where people searched for your keywords, or where people saw your Google Adwords ad that ultimately led them to create a session on your site.
This is one of the biggest key performance indicators because this tells you where you are truly having an influence. If a source comes up as “Google”, then you’ll know a user found you through a Google search. Typically you will get visitors from AdWords campaigns… if they are done in a meaningful and strategic way.
11.) Cost per Transaction: Part of navigating your Google Analytics account is understanding which Adwords campaigns have produced profits or conversions for you.
You can set up a specific metric to measure cost per transaction of specific campaigns. This will tell you how much you need to spend in order to generate a transaction.
Your campaigns can be anything from AdWords ads to web banners or an email campaign. Depending on how much success you want to get out of each campaign, you may need to boost your spending for an attainable conversion rate.
If you have an advertising budget for your business, then measuring your cost per transaction is one of the most important indicators to focus on.

12.) Organic Verses Paid Sessions: Google Analytics can track how each session was created. Organic sessions occur when users naturally find your page through search engine results.
High organic session rates imply that your SEO strategies are performing well, and your website is ranking high on search engine lists. Paid sessions indicate how much traffic was generated through paid ads.
Search engine ads, banner ads, and other AdWords campaigns will generate traffic for you depending on how much you spend on them. Your initial advertising budget will determine your paid session rate.
Looking at paid sessions alone may not be the best metric for tracking your overall performance since it depends so much on your budget. This makes it very important for you to track the rate of organic sessions alongside the paid sessions in order to get a solid idea of your current success rate.
13.) Average Session Length: Tracking the number and source of your sessions is one thing; defining the average length of the session is another important performance indicator.
The average amount of time a user spends on your website can give you a wealth of information about how well your website is performing, such as:
- The average session length can also provide you with information about the user’s activity.
- What time or date did they start their session?
- How many pages did they visit?
- Are most of the longer sessions bounces or does each user explore more of your website?
Then you can determine whether or not you are able to capture those conversions and create more potential customers.
Session length can give you insight as to how close you are at reaching your goals, especially if you want to encourage other users to stay for longer sessions. The Google Analytics Developers suggest a direct correlation between session length and pageviews.

14.) Pageviews: Much like sessions, pageviews show how many users are visiting your site. But more specifically, pageviews track visitations to each individual page.
While sessions count overall visitations, pageviews focus on the metrics of each individual URL on your website.
Some businesses have a single web page; in this case, the pageviews metric may not be as useful since there are not multiple pages to track.
Depending on your overall conversion goals, pageviews can help you relate your average success on a reportable level. Pageviews equate to conversions, an actionable metric that will imply that AdWords or SEO changes worked as you wanted, based on your level of success.
15.) Contacts and Subscriptions: Google Analytics can now track the number of contacts or email sign-ups you get from visitors and users.
If you run a subscription service, you can measure success and justify your budgetary needs based on how many subscribers you gain per conversion method.
Not only is it useful to focus on those who have signed up, but you also need a metric to track how many people have reached out to you via a contact form on your website. Perhaps you also run an online chat service; make sure you have event tracking set up in Google Analytics to measure the success of these additional contact methods.

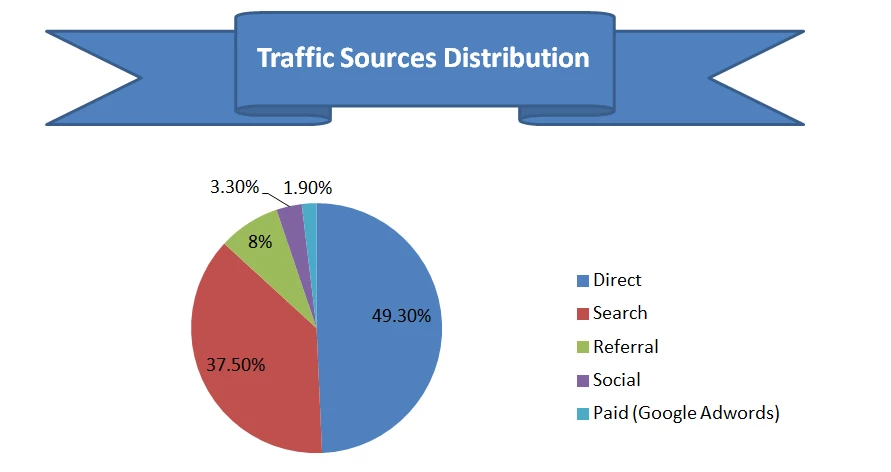
16.) Traffic Distribution: Your traffic can tell you a lot about how your website is performing.
Measuring the overall amount of traffic you generate, both through paid traffic metrics and organic traffic metrics is a useful Key Performance Indicator (KPI) for determining actionable next steps. However, it’s important to focus deeper and also take a look at the behavior of the traffic itself.
You can breakdown your website’s sources of traffic by using a traffic distribution report through Google Analytics in order to see where your best traffic comes from.
- Is this traffic behavior in line with your overall conversion goals?
- Are there certain pages that aren’t generating as much traffic as others?
This KPI can give you a lot of insight when determining a new campaign or conversion strategy.
17.) Page Load Time: Measuring the average page load time can be a useful Google Analytics tool in case your sessions aren’t as numerous as you’re expecting.

This is an especially helpful metric in the event that your website is accessed by people in multiple countries. Depending on how large your business is, you may see faster or slower page load times per region.
Understanding the importance of page speed is key. Most users expect speedy results… and slower page loads lead to higher bounce rates.
You also need to uphold a standard of quality, especially when you are investing money into Google Ads campaigns. You have a reputation to uphold and you want to get your money’s worth. So making sure the page load times are hitting standards and not falling below the mark is a necessary fix if needed.
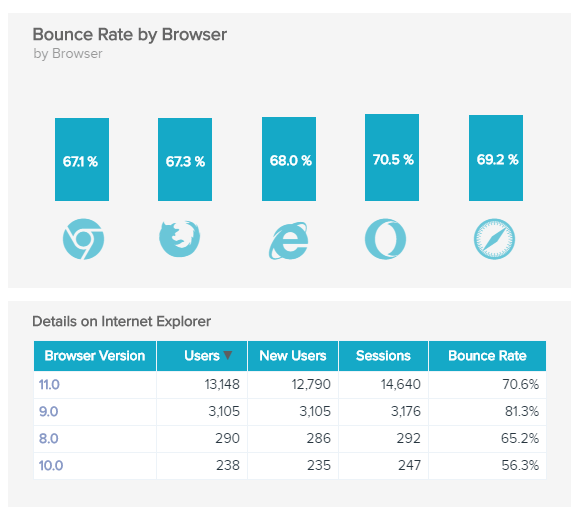
18.) Browser Bounce Rate: Did you know that your bounce rate can change depending on the Internet browser your visitors are using?
This fluctuating metric can be more difficult to track when your users are getting different experiences depending on whether they are using Google Chrome, Mozilla Firefox, Internet Explorer, Safari, or another browser.
Data Pine provides details on the average bounce rate on Internet Explorer (in their image below), which can be compared to other browsers as well.
Knowing the differences on the user’s end can be helpful in deciding what tools to use next in order to get closer to your conversion goals.
19.) Average Transactional Value: What’s the average amount of money you make per transaction with all users and sessions on your website? This is what the average transactional value indicator will track for you.
You can get information about whether your upselling tactics work when you navigate sales online. And this doesn’t always have to equate to monetary value; you can track whatever type of success equates to you reaching your goals.
Typically, this metric will measure the efficiency of your cross-selling tactics via the Ecommerce tab in Google Analytics.

20.) Top Landing Pages: A landing page is the page your visitors first get to when they come to your website. Knowing the top landing pages on your site will give you a deep insight into whether or not your Ads campaigns are working correctly. In other words:
- Which page do you want your users to land on the most?
- Is that the current top landing page?
- If not, what can you do to direct more traffic towards the desired page?
A lot of work goes into optimizing each web page using SEO strategies and keyword placement, so you can certainly influence the top landing pages. Taking a look at this metric through Google Analytics will help you configure the correct conversion channels to guide users through in order to drive business up and get closer to your goals.
I do hope this list of Google Analytic Indicators is explained in layman’s language and easy enough to understand. Believe me, you are not alone with it comes to being easily confused by Google Analytics, so I do hope you will share this post with your friends.
Should you have any question regarding anything discussed here, I look forward to chatting with you in a comment below.
Credit for Header: image by ID 115299192 © Vadymvdrobot | Dreamstime.com

![Ibrahim.ID [CC BY-SA 4.0 (https://creativecommons.org/licenses/by-sa/4.0)]](https://www.eparrs.com/blog/wp-content/uploads/2021/09/Social_media_icon.webp)


